

Murex Ledger
Dashboard
Designing a global FX Capital Markets reconciliation workflow - from a 6-step manual Excel pipeline to a real-time command center with AI-assisted exception management.
Role:
Senior Product Designer
Tools:
Figma
Domain:
FX Capital Markets - Ops
Team:
Inspire11 · EY · Synechron

6→1
Pipeline steps collapsed by design
108K+
Daily transactions per currency, per entity
Extended
NT engagement renewed post executive demo

The Problem
Six manual steps stood between a trade and the truth.
Every day, Northern Trust's Capital Markets team processed hundreds of thousands of FX transactions across global currencies and entities — INR, USD, EUR, GBP and more. But reconciling Murex ledger balances against Nostro cash positions required one person — Julian at Synochron — to manually run SQL scripts, pass outputs through a legacy app, and execute Excel macros before EY could begin their work.
No automated error detection
Single point of failure
No real time visibility
Currency by currency bottle-neck
1.
Julian runs 2 SQL scripts manually - Cash script + Ledger script, executed separately in Murex via Synechron
2.
Murex design app compares outputs - Field-by-field matching — amount, flow ID, currency — no exception categorization
3.
Excel macro transforms the data - Manual formatting pass to "make it look pretty" before handoff
4 - 6.
EY receives and begins reconciliation (Bottleneck) - No audit trail, no error categorization, no way to trace a break back to its source
Design Process
From wireframes to working prototype - grounded in the real data model.
I started with stakeholder alignment before touching high-fidelity design. Working directly from Julian's SQL outputs and Drew Wallace's EY reconciliation requirements, I wireframed the core data structure first — establishing the hierarchy, the reconciliation formula, and the filtering logic with NT and EY before any visual decisions were made.
01 — Discovery
Understand the data before designing the interface.
Attended kickoff sessions with NT, EY, and Synechron. Mapped Julian's SQL pipeline, documented the 6-step manual process, and identified the core reconciliation formula: Nostro − AIS adjustments = Resultant vs. Ledger.
02 — Wireframing
Validate structure and hierarchy with stakeholders.
Designed a functional wireframe establishing Currency → Branch → Bank Code → Flow ID hierarchy, filter logic, and the Nostro / Resultant / Ledger / Difference column structure. Reviewed and iterated directly with NT and EY finance teams.
03 — Prototype
Elevate into a real-time command center.
With the data model validated, I pushed the design forward — adding real-time KPIs, a 7-day trend chart, AI-assisted exception diagnostics, transaction drill-down, and full audit trail. Delivered to NT leadership. Craig asked on the spot to deploy it for February month-end. The engagement was extended.
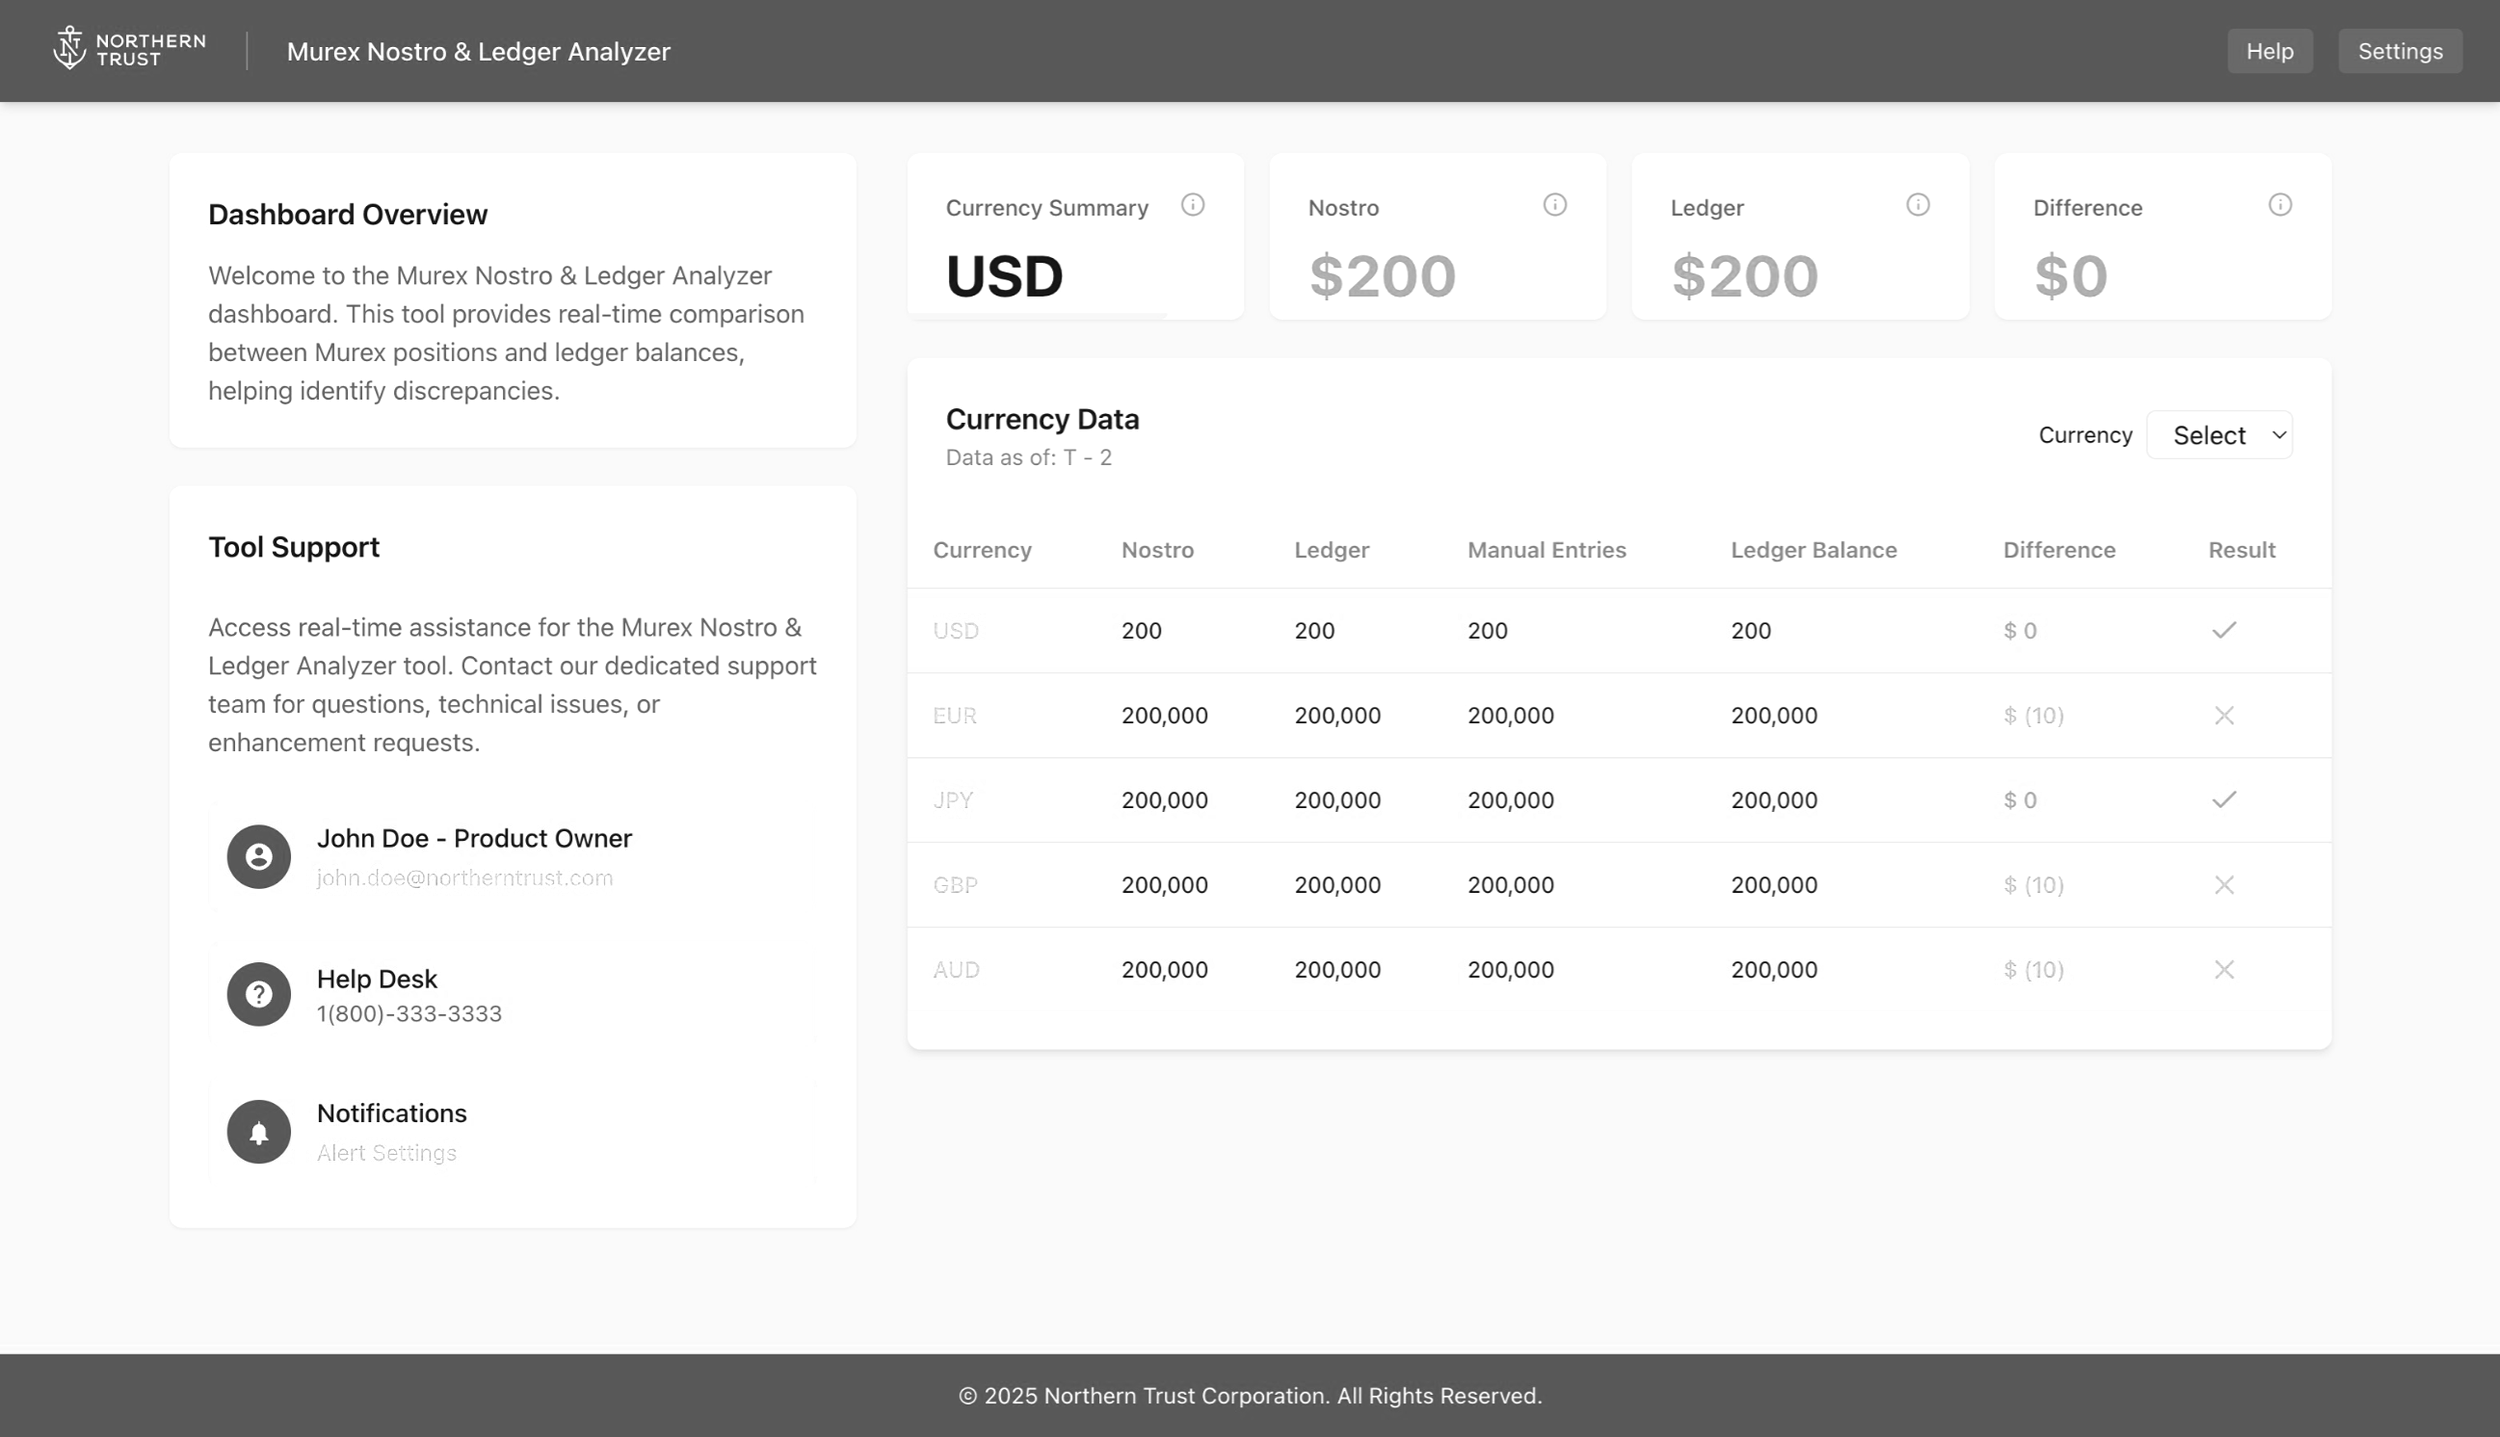
Murex Nostro & Ledger Analyzer — early wireframe reviewed with NT operations and EY finance teams. Established currency summary, filter logic, and the Nostro / AIS / Resultant / Ledger / Difference data model.
The Solution
A reconciliation command center — built around how analysts actually think.
I designed and built a reconciliation command center that collapsed the 6-step pipeline into a single, automated view. The interface surfaces Nostro vs. Ledger positions in real time, prioritizes breaks by severity, and gives analysts the diagnostic context they need to resolve exceptions — not just find them.
All values shown are illustrative
Key Features
Designed to surface the right information at the right moment.
Executive KPI Bar
Total cash, ledger balance, net variance, match rate, and unresolved breaks — surfaced at a glance without running a single script.
Reconciliation Trend Chard
7-day chart with a compressed 95–100% Y-axis. A drop from 97.8% to 96.1% looks dramatic — as it should. That's millions in unmatched cash.
NT Insights — AI Assistant
Pre-diagnoses every break with cause and recommended action. Reduces 30 minutes of manual investigation to 2 minutes per exception.
Severity-Tiered Exceptions
Breaks are automatically categorized as Critical, High, Medium, or Low — with AI-generated root cause analysis and recommended actions.
Currency & Status Filtering
Dynamic filter bar across USD, EUR, GBP, JPY, CHF, AUD — and status filters (Matched, Break, Pending, Investigating) that update the transaction table instantly.
Transaction Detail
Every trade tells a complete story.
Clicking any row in the transaction table opens a slide-over panel with the full picture: trade metadata, a direct Murex-to-Nostro comparison, variance calculation, and a timestamped audit trail showing exactly how the trade moved through the system.
This directly replaced the manual process of cross-referencing Excel spreadsheets — giving analysts the same information in one click instead of 20 minutes.
Outcome
The demo stopped the room. The engagement was extended the same week.
The dashboard was presented to senior Northern Trust leadership — including Craig, Kevin P., and Richard E. The response was immediate. Craig asked on the spot whether the solution could be deployed for February month-end. Northern Trust extended the engagement — and continues to be an active Inspire11 partner building on this foundation.
“Aaron made an immediate and highly positive impact on the project. His turnaround time was exceptionally fast and he delivered all assigned tasks. I would welcome the opportunity to work with him on future projects.”
5/5
Rating from project lead Jeff M. — "consistently met and exceeded expectations in all areas of Client Delivery"
6→1
Manual pipeline steps replaced by a single automated dashboard view — from SQL scripts and Excel macros to a real-time command center
Day 1
Craig asked on the spot whether the solution could be deployed for February month-end — executive buy-in achieved in the demo session itself
Reflection